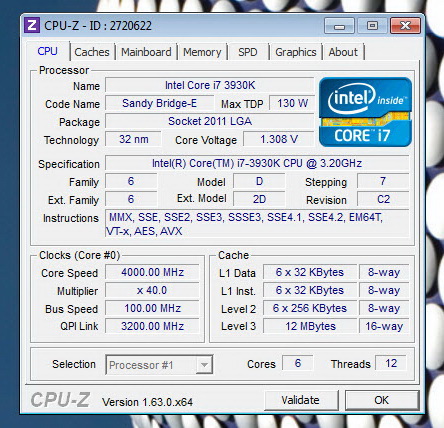
TEST BED


TESTING METHODOLOGY
Thoroughly testing hard disk and solid state drives may require time and lots of patience but that's just about it. Of course that doesn't mean that one must take it lightly, at least not when people actually base their decision on your results. Because of that we always like to take things a step further not because we have to but because we want to be almost 100% certain of the results we get and post in our charts.
SAS drive testing however is more complicated than testing regular SATA drives and so although we use the same 6 benchmark suites as with SATA tests in an effort to bring you the most accurate results across the board things are a bit different since we are required to configure/tweak some of those programs to address compatibility issues with the SAS card used. This may not be exactly "fair" for the SAS drive/s in hand since we test them with much heavier read/write loads in some of the suites used but that's the only way to get realistic results without taking into account certain extreme card-specific performance optimizations. So once again the benchmarking applications we use are the AIDA64 suite (former Everest Pro), HD Tune Professional (Partial Test/Full Accuracy), HD Tach RW (Full Bench), ATTO (2GB Length), Sisoftware Sandra Pro and the Crystal Disk Mark 64bit (2000MB mode). These benchmark tools are the best at what they do and as you will also see later on their results more or less agree. Each test is performed a total of 6 times and then the average is recorded into the charts. Temperatures are recorded using Hard Disk Sentinel and after 45 minutes of continuous testing in a 23 degrees Celsius temperature controlled room.
Last but not least do take into account that we use dedicated and separate performance charts for 2.5"/3.5" drives as we do for Internal/External and HDDs/SSDs so if you want to compare the performance of a 2.5" drive with that of a 3.5", an internal drive with an external or that of an HDD with that of an SSD you need to check the corresponding charts.

 O-Sense


.png)

