INTRODUCTION
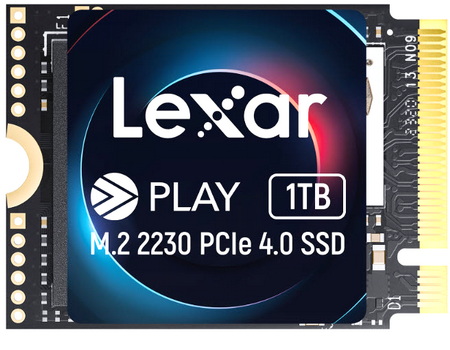
As demand for portable gaming consoles increases SSD manufacturers are also doing their part by releasing faster (and in most cases also more durable) storage media (compared to factory/default ones) for them and right now those happen to be M.2 2230 NVMe SSDs. Unfortunately, demanding users who may have their eyes set on high capacities of 4TB and above will have to wait for a while since currently the highest capacity for a single side M.2 2230 SSD is capped at 2TB (dual side models are not compatible with some handhelds). On the other hand, users looking to upgrade to even just 1TB have quite a few solutions available to them and the PLAY model by Lexar is among them.
For more than 25 years, Lexar has been a trusted leading global brand of memory solutions. Our award-winning lineup includes memory cards, USB flash drives, card readers, solid-state drives and DRAM. With so many options, it’s easy to find the right Lexar solution to fit your needs. All Lexar product designs undergo extensive testing in the Lexar Quality Labs with more than 1,100 digital devices, to ensure performance, quality, compatibility, and reliability. Lexar products are available worldwide at major retail and e-tail stores. For more information or support, visit www.lexar.com.
For the PLAY 1TB M.2 2230 NVMe SSD (yes, only one capacity currently available) Lexar chose to go with the quad-channel DRAM-less SM2269XTF PCIe 4.0 Gen 4 (NVMe v1.4) NAND flash controller by Silicon Motion and Micron 176-Layer 3D TLC (B47R) NAND flash (5200MB/s reads - 4700MB/s writes). The Silicon Motion SM2269XTF DRAM-less controller has been used many times in the past and features technologies like 4K LDPC error-correction (ECC), RAID, TRIM, SMART, device sleep (power management), garbage collection and real-time AES-128/256bit encryption (TCG Opal 2.0 compliant). As for warranty Lexar covers the PLAY 1TB with a five-year limited one and regarding endurance they report an MTBF (meantime between failures) of 1.5 million hours and an TBW of 600 for the PLAY 1TB (and yes, these are very good numbers, as expected from 3D TLC NAND flash).
SPECIFICATIONS AND FEATURES

PACKAGING AND CONTENTS
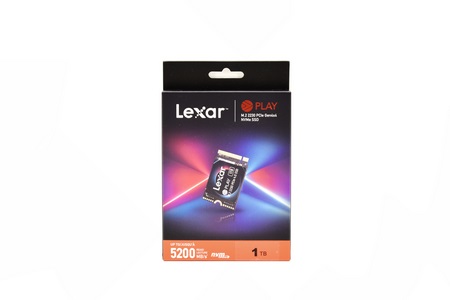
The company logo is located at the front of the box right over a product picture, name and capacity.
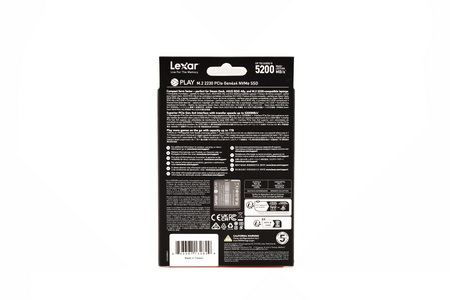
A few words about the drive are placed at the rear of the box in multiple languages right over an opening from where you can see the product serial and barcode.
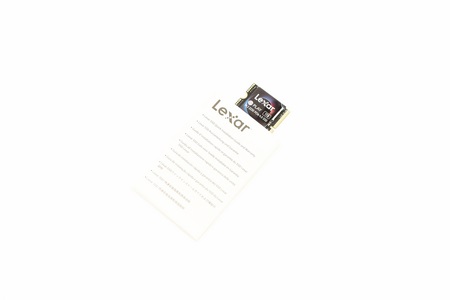
Inside the box you'll find the PLAY 1TB M.2 2230 SSD and the user manual.
THE PLAY 1TB
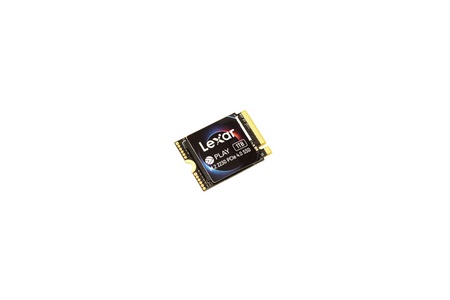
A sticker with the company name and the product name and capacity is placed at the top of the PCB.
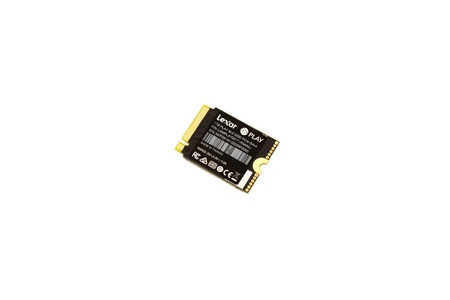
The product serial, barcode, country of manufacture and several certifications are placed on a sticker located on the other side.
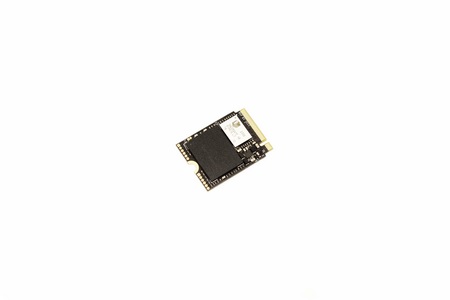
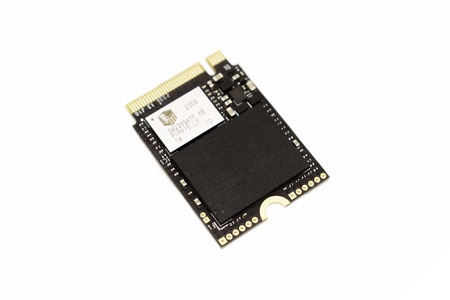 Removing the top sticker reveals the DRAM-less SM2269XTF Gen4 controller by Silicon Motion and a single 176-layer 3D TLC NAND flash module by Micron.
TEST BED

TESTING METHODOLOGY
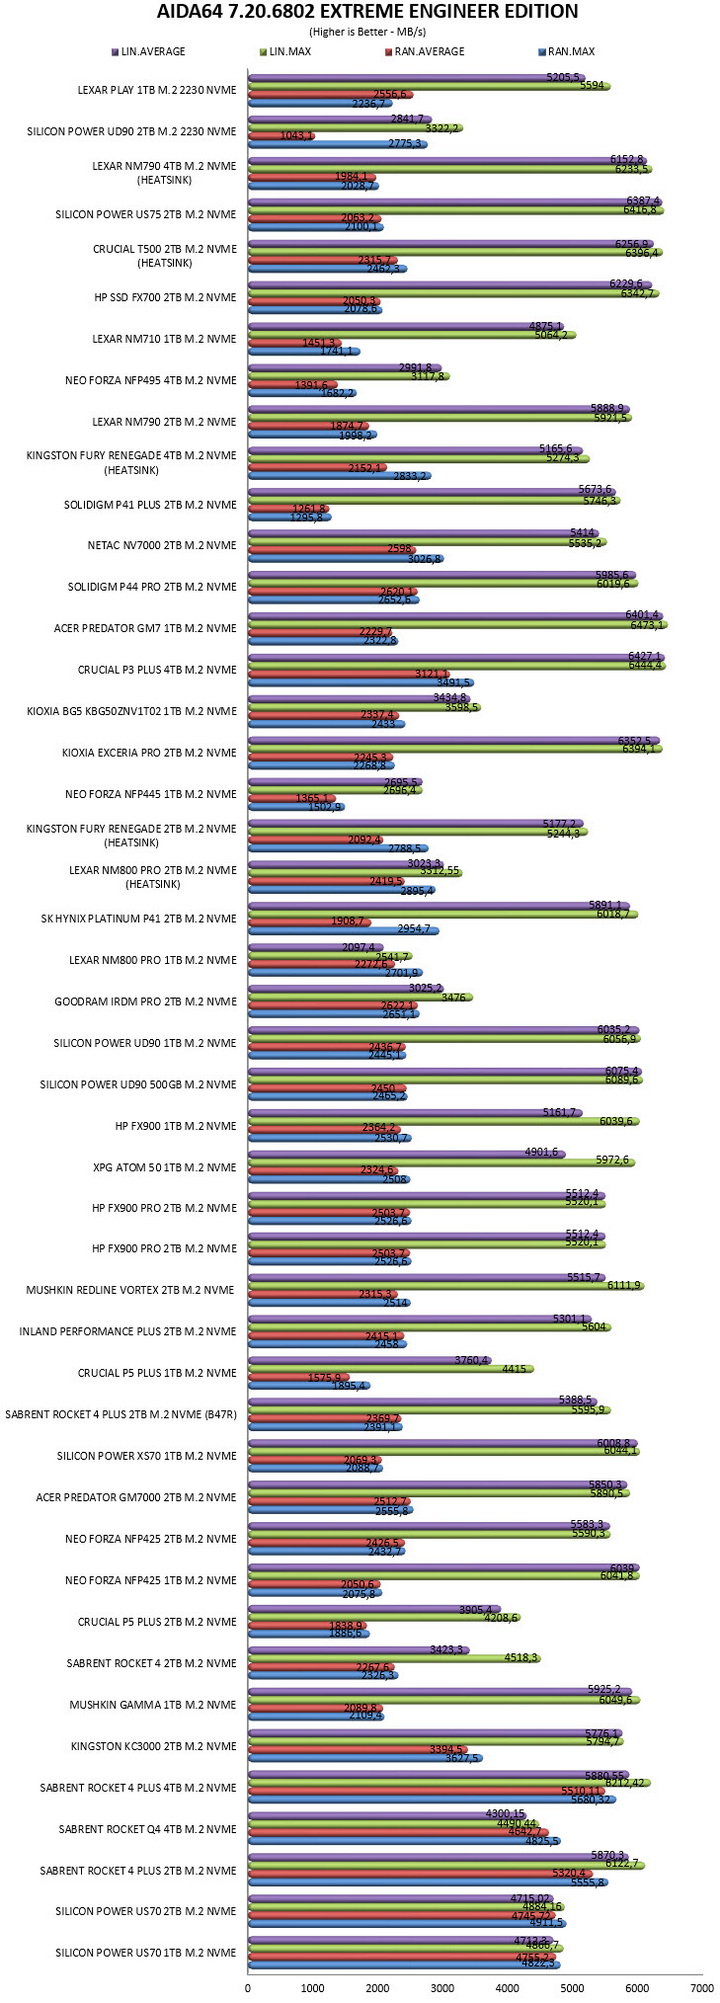
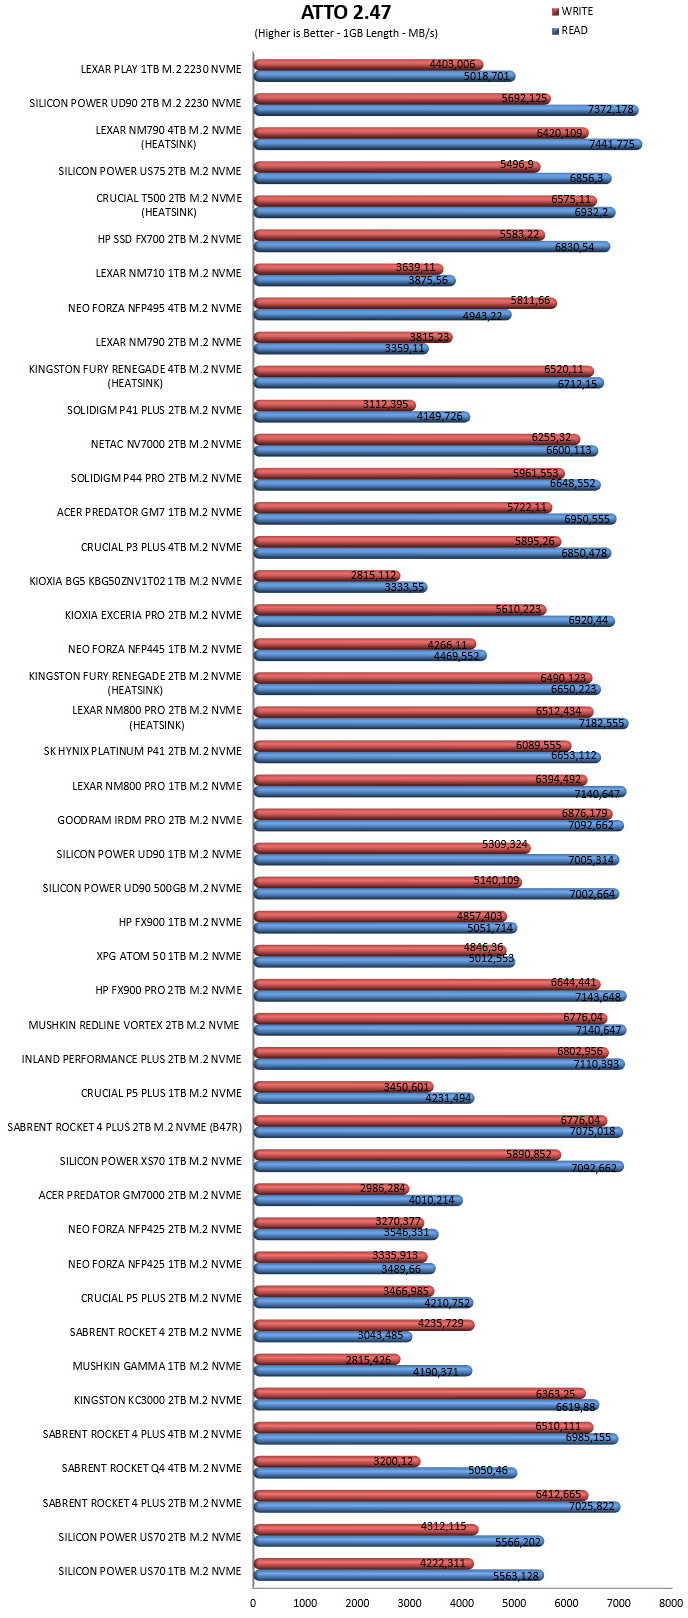
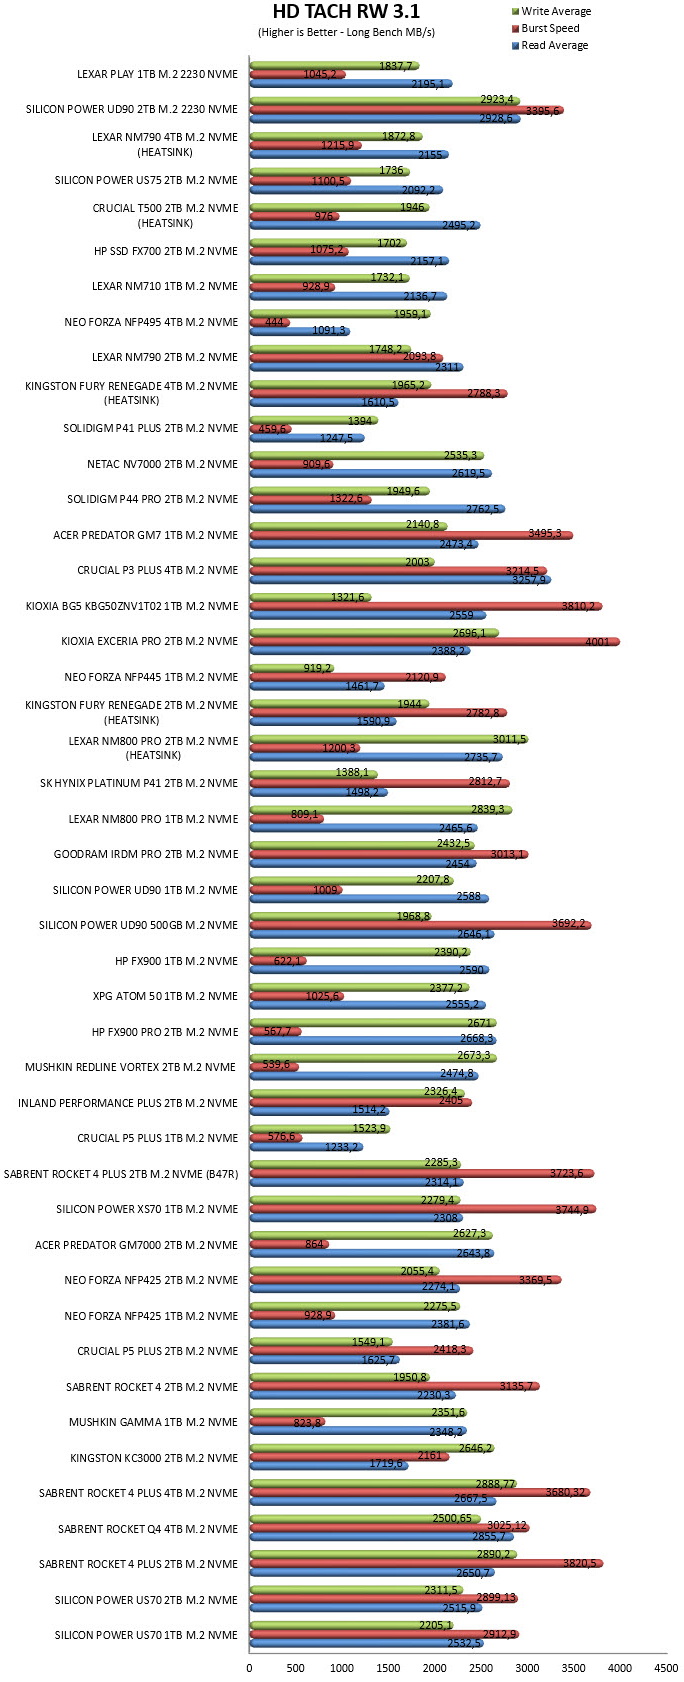
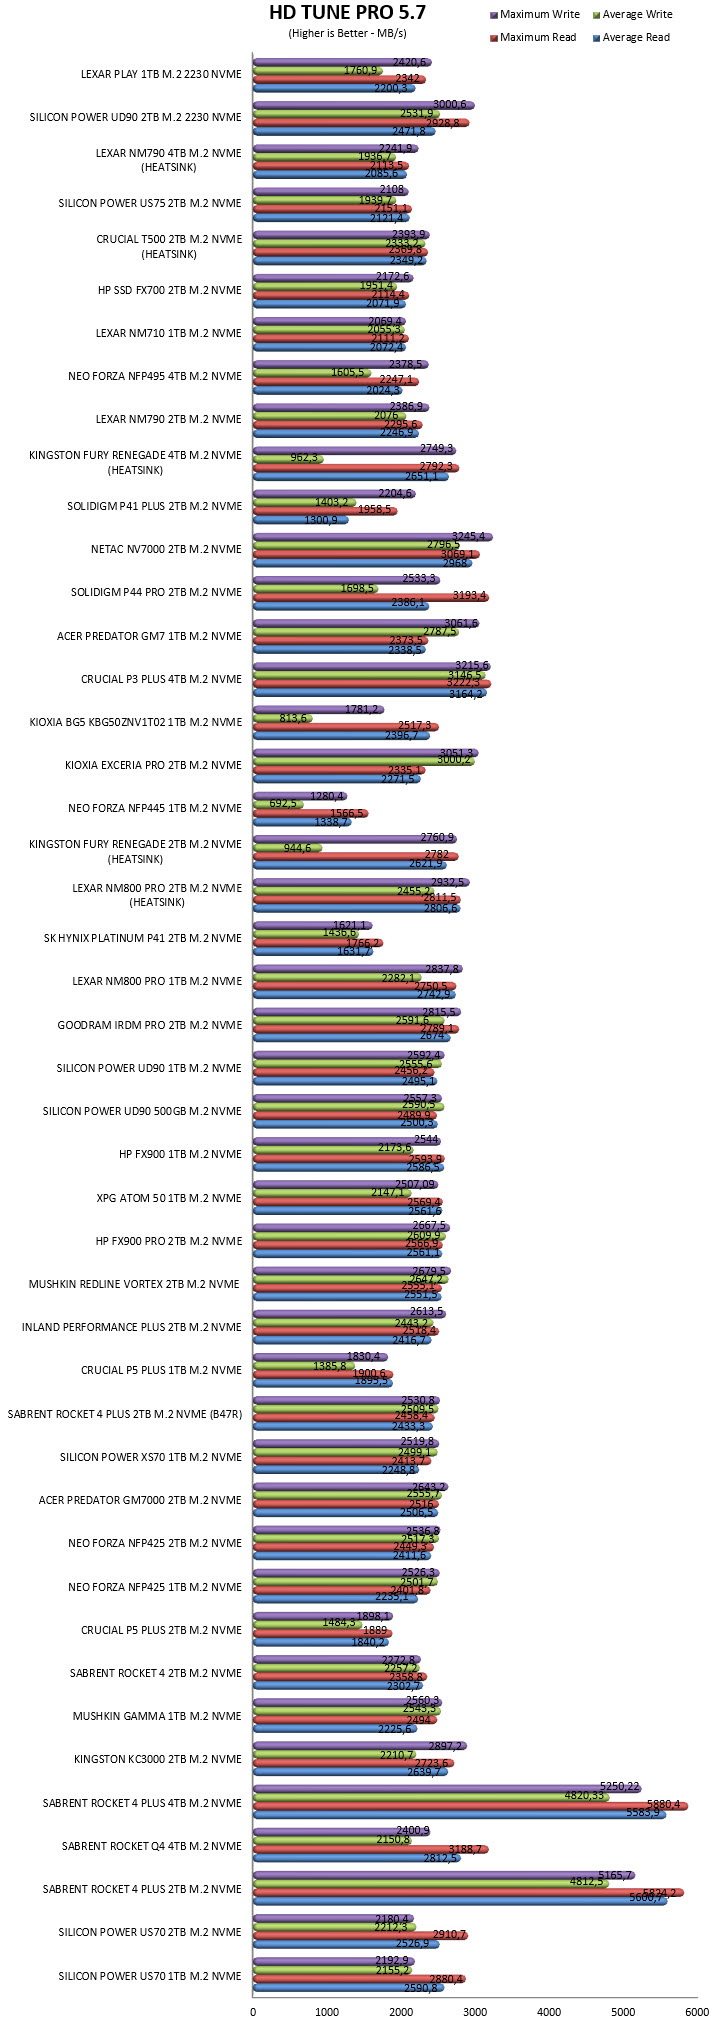
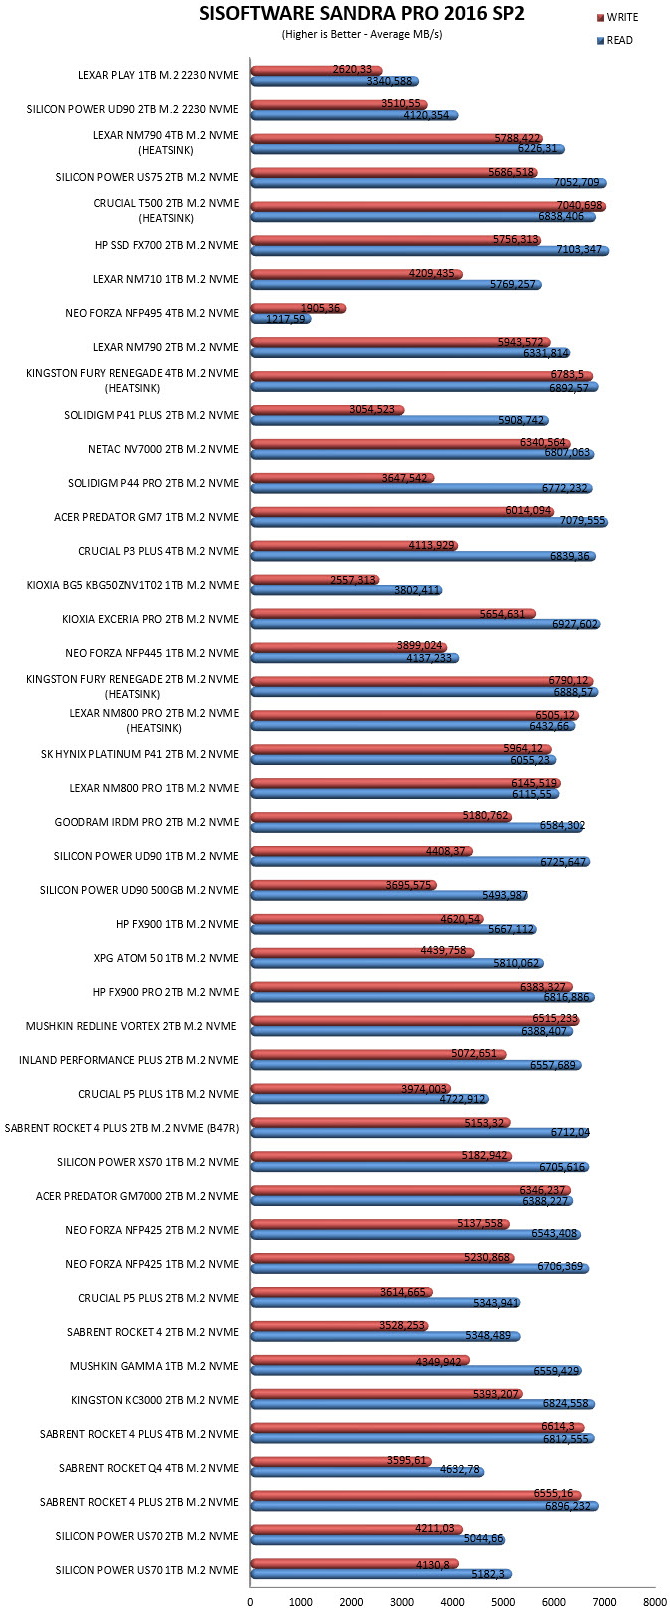
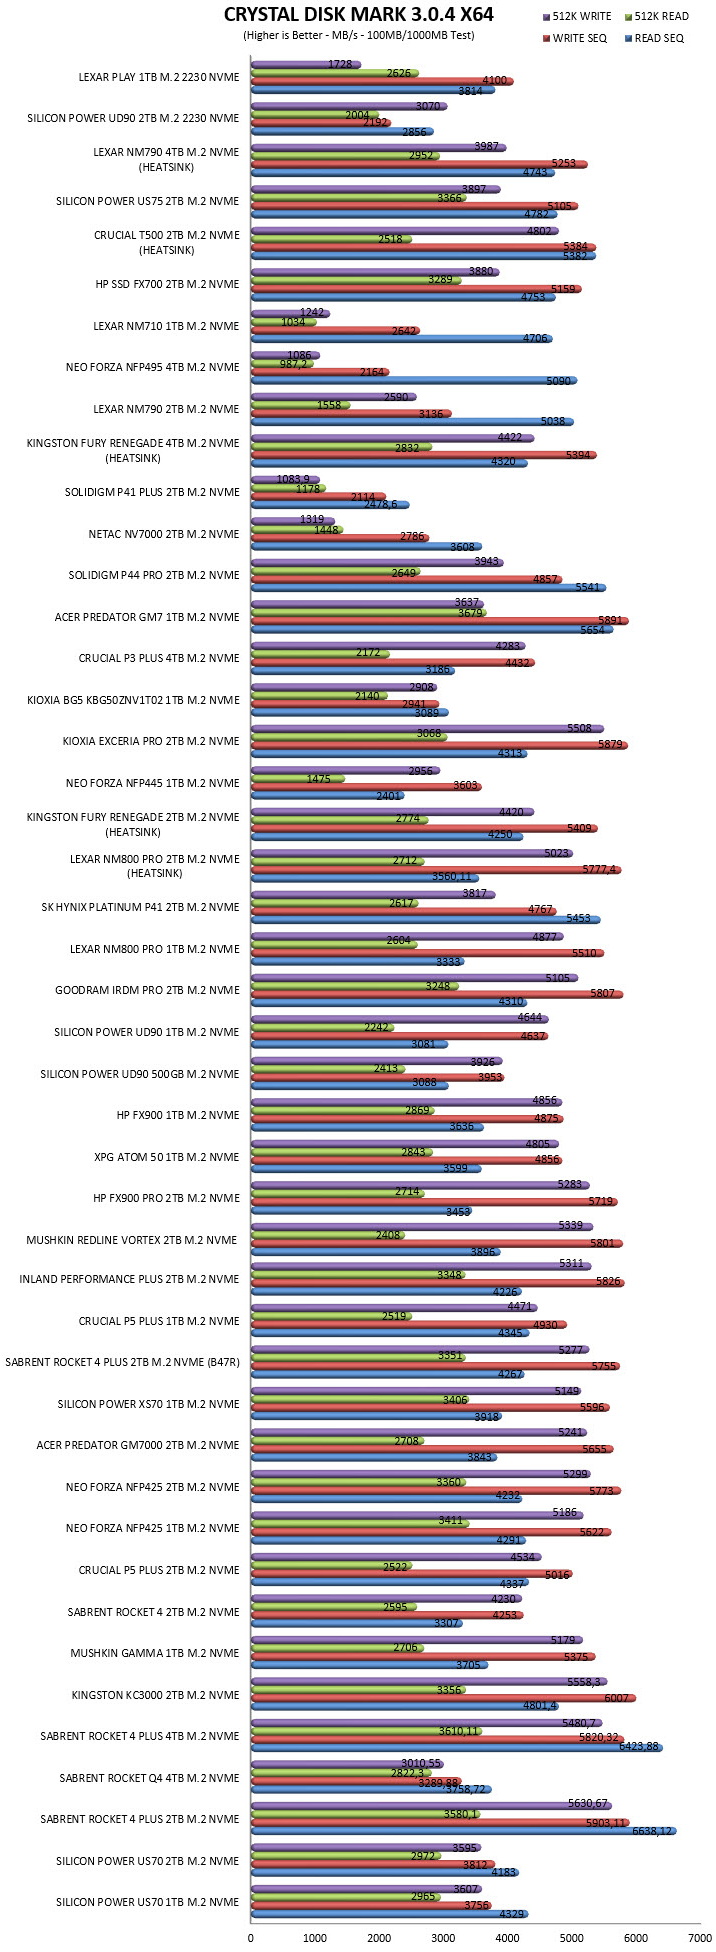
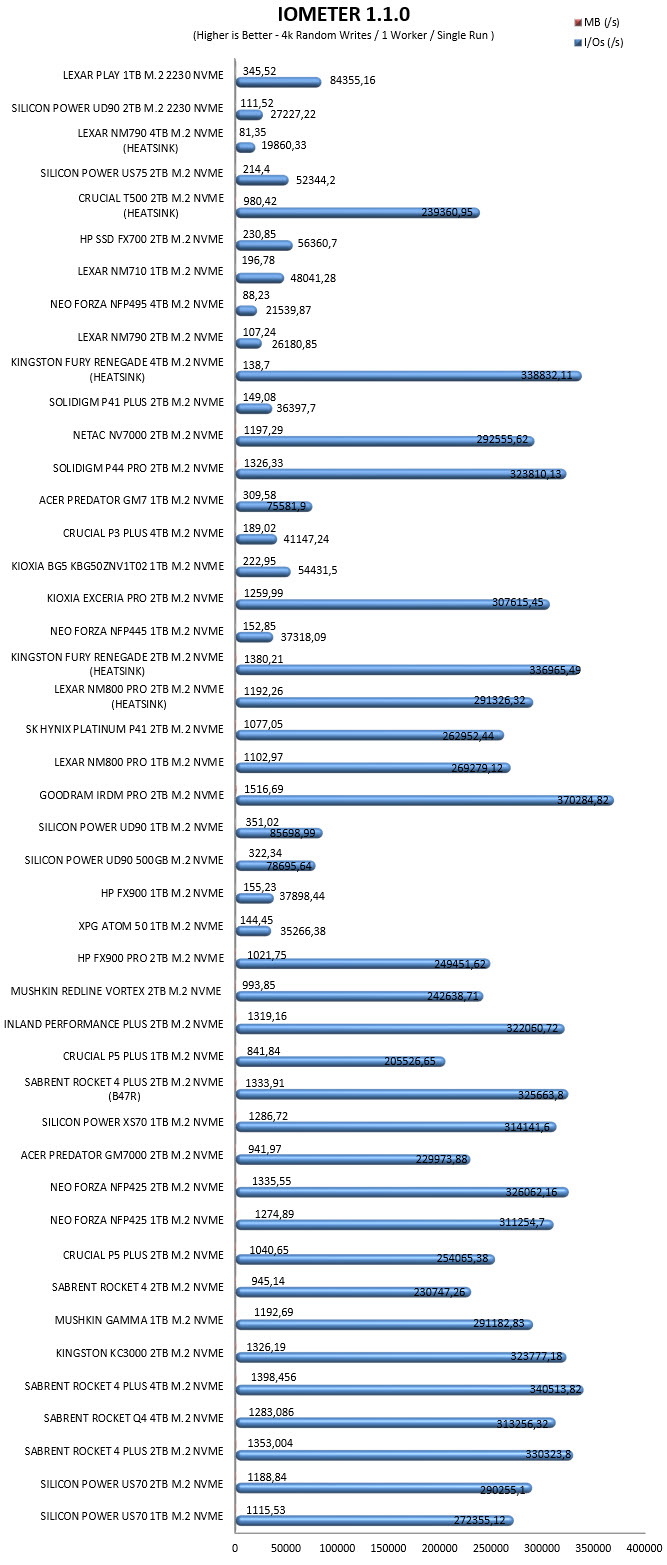
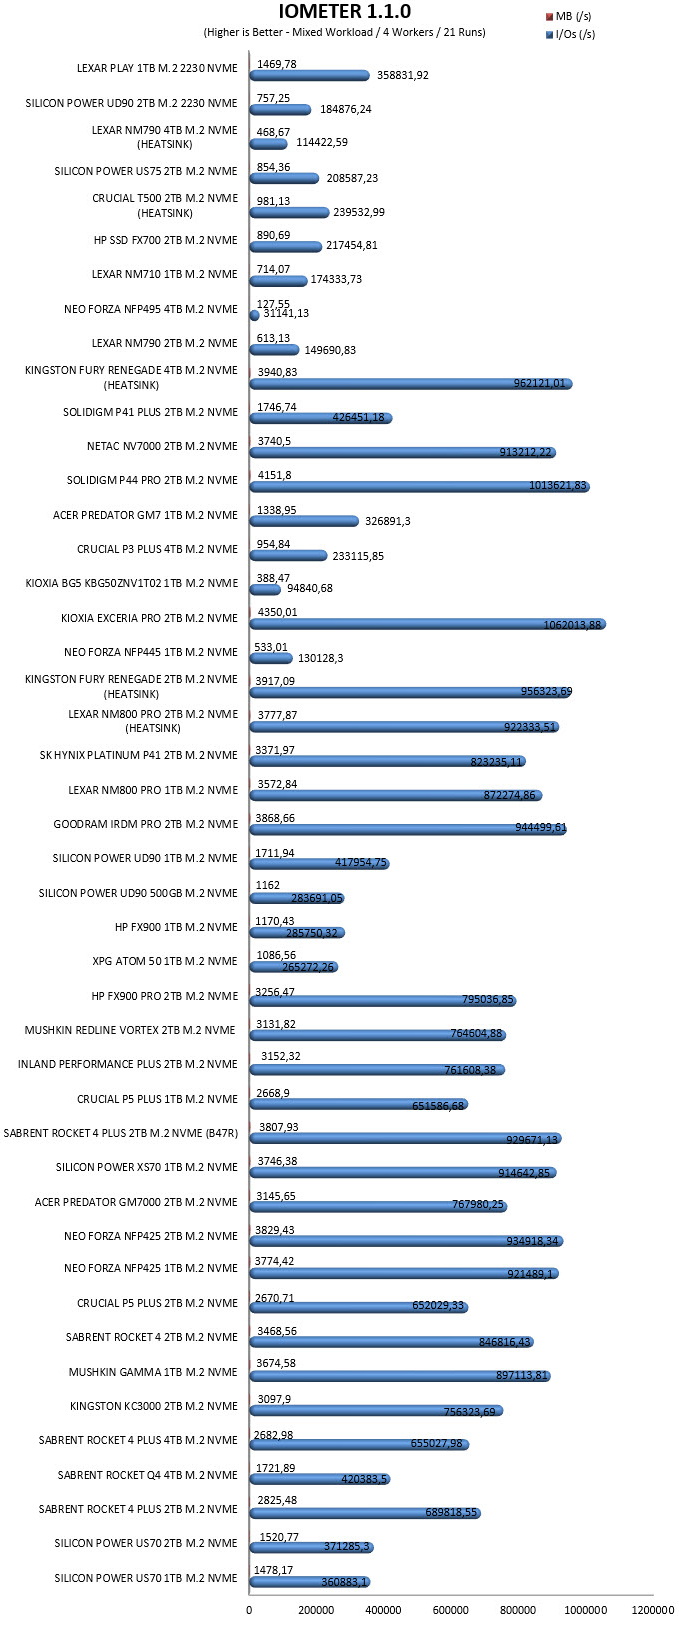
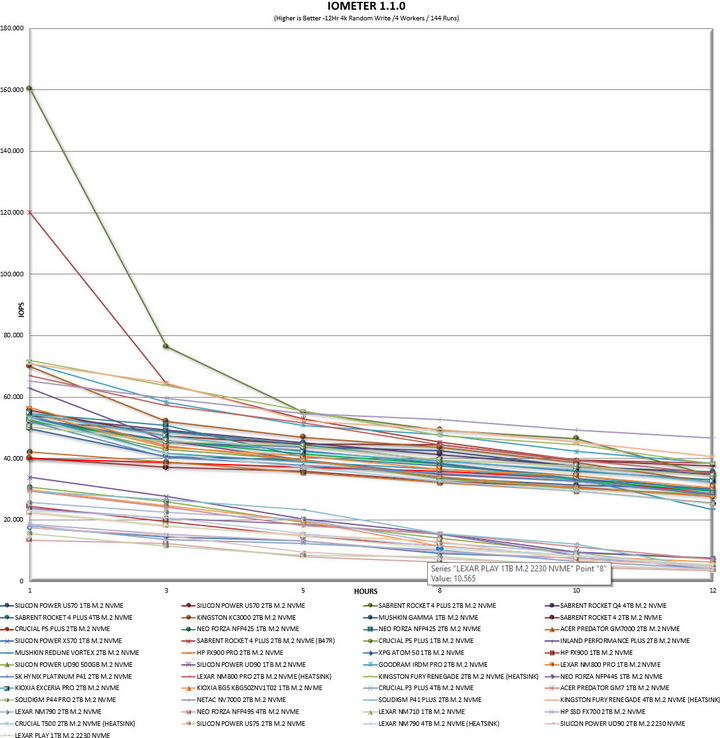
Not long after I first started testing SSDs back in 2008, I concluded that it's almost impossible for any single benchmark suite to accurately measure their performance and that's why in certain benchmark suites we see amazing read/write performance numbers with some drives while in others things are quite different. The reason behind this is that some benchmarking suites are configured to read and write random chunks of data while others read and write constant (sequential) ones. So that's why i always use a very wide selection of benchmarking suites including AIDA64, HD Tach RW, HD Tune Pro, Crystal Disk Mark, Sisoftware Sandra Pro, AS SSD, IOmeter and ATTO. To get the most accurate results each test gets repeated a total of 6 times with the average performance numbers recorded into the charts*/****. Also, as of February 25th 2015 our results will also include the Storage Networking Industry Association’s (SNIA) IOMeter tests. These tests include a 12 Hour write test used to “simulate” performance degradation over time and a mixed workload test which basically shows what you can expect when using an SSD continuously for roughly two hours. Unfortunately, due to the time required for these tests they get repeated a total of 3 times and not 6 as the above.
Many people have made inquiries about our charts in the past so once again please do keep in mind that the Charts have the average performance numbers of each drive recorded and not the peak (highest) ones. Also, although every single one of these programs can help potential buyers choose the right drive for their needs you should also remember that from any kind of benchmark up to real world usage the gap is not small (and usually most differences will go unnoticed by most people). All tests were performed in a fresh Windows 10 Pro x64 installation complete with every update up to the date of this review.
* Since November 2018 the SSD comparison charts have been divided to 2.5” and M.2 models to reduce their growing size.
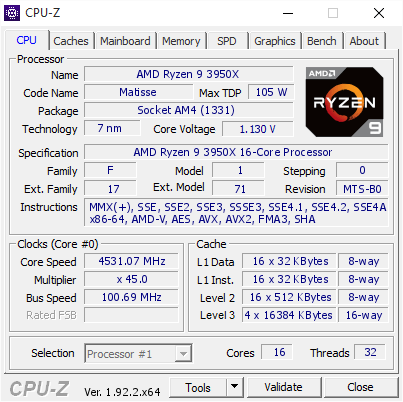
** Unless stated otherwise the Ryzen 9 3950x based Test Rig used for M.2 Gen 4 SSD reviews is not located in the lab.
*** As of January 2021 for Gen 3x4 models I’ll be using the Core i9-7980XE test rig (after numerous tests the up to 6% difference in read & write performance compared to the i7-6700 system simply wasn’t enough to justify having an extra test rig around).
**** Since February 2022 M.2 NVMe Gen3 and Gen4 SSD drives are placed in different charts.
TEST RESULTS - AIDA64 / ATTO
TEST RESULTS - HD TACH RW / HD TUNE PRO
TEST RESULTS - SISOFTWARE SANDRA PRO / CRYSTAL DISK MARK
TEST RESULTS - AS SSD / IOMETER

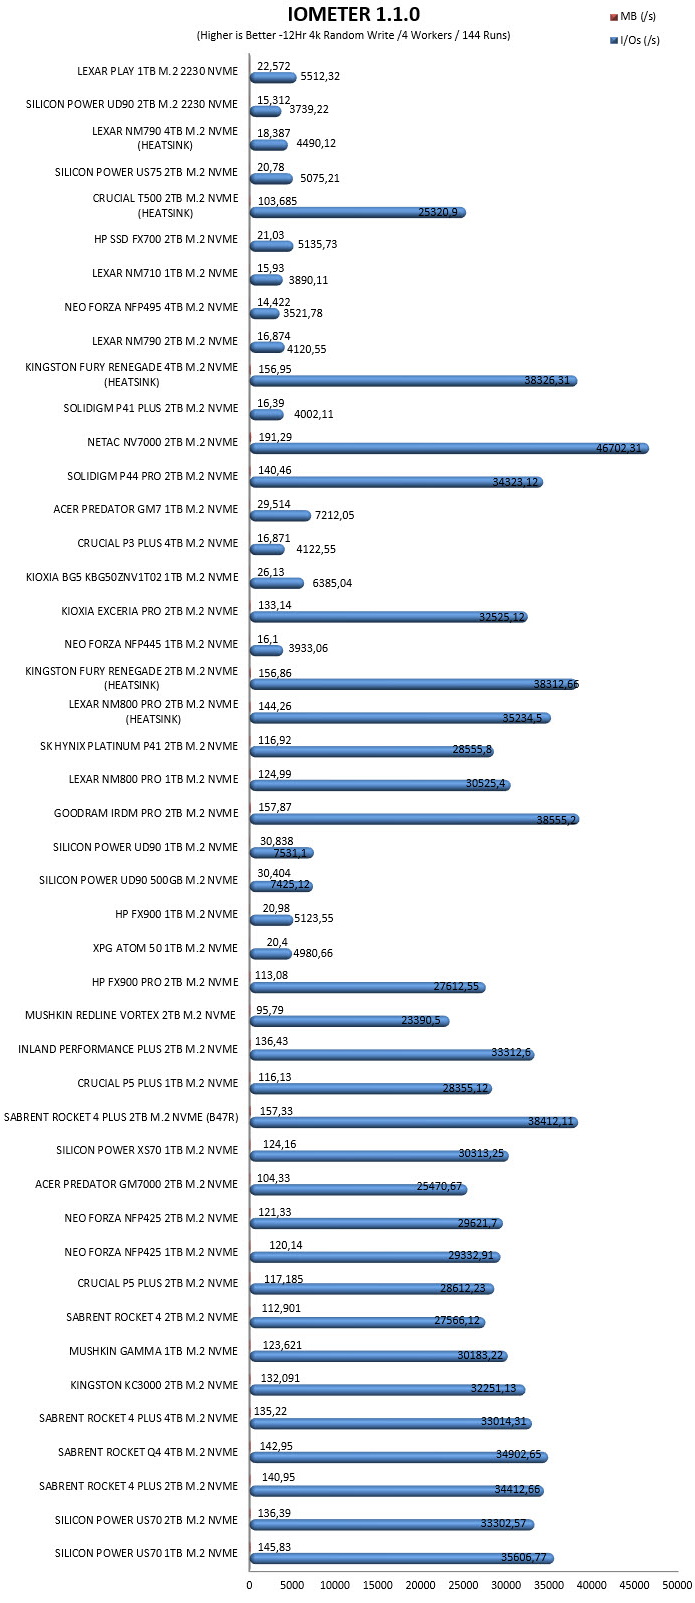
TEST RESULTS - IOMETER SNIA
CONCLUSION
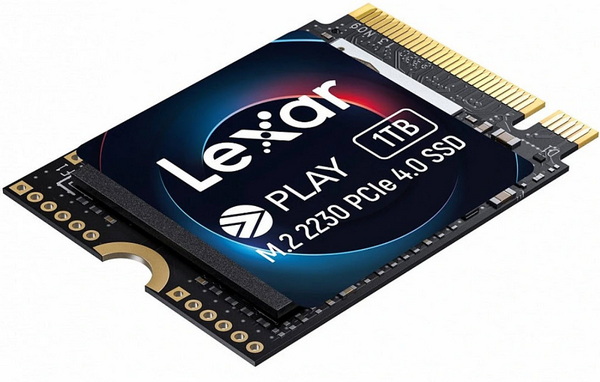
The PLAY 1TB M.2 2230 NVMe SSD by Lexar trades blows with the UD90 model by Silicon Power in my charts, even though it’s 1TB in capacity (usually slower than the larger 2TB models). This means that it should easily surpass both in speed and durability whatever both the Steam Deck and ASUS ROG Ally come fitted with from the factory. My actual issue with the PLAY is capacity and only a 1TB model when there are 2TB M.2 2230 models available is clearly not a good move by Lexar. Yes, 1TB should be enough for some users but when there are many who ask for 4/8TB models I think that 2TB is the least every manufacturer should have in their M.2 2230 SSD lines.
Right now, the PLAY 1TB M.2 2230 NVMe Gen4 SSD by Lexar retails for USD84.99 inside the USA (Amazon.com) and for 117.32Euros inside the EU (Amazon.de) and so it’s priced rather well, at least on the other side of the Atlantic (once again). At the end of the day even though both the UD90 and the PLAY are more or less identical in performance the former is the obvious choice (at least currently) for people who need or want the extra capacity. Overall, however both models deliver the same level of performance and endurance and so even if it’s 1TB in capacity I strongly recommend the PLAY if that amount is sufficient for you.
PROS
- Very Good Overall Performance
- M.2 2230 Form Factor (Gaming Handhelds)
- 5 Year Limited Warranty
- Price (USA)
CONS
- Price (EU)
- 1TB Maximum Capacity (Currently)

 O-Sense




.png)

