WEB INTERFACE PART 1
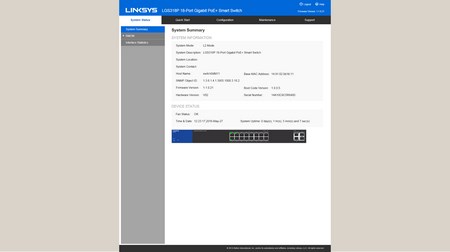
Once you access the web interface you will see the system summary page which shows you which ports are being used, the firmware and hardware version, serial number and device uptime.
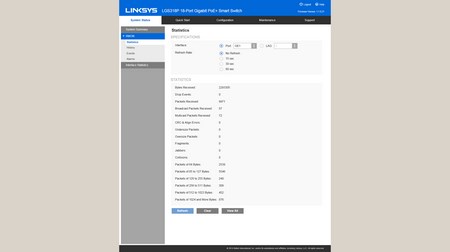
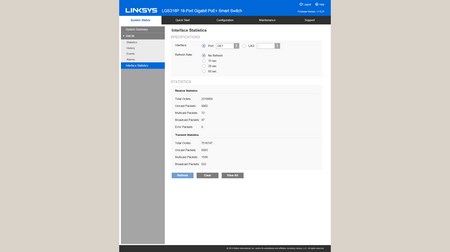
From the RMON drop-down menu you can access the statistics, logs, events and alarms of all ports.
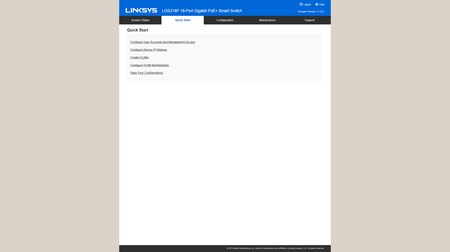
The quick start tab acts like a setup wizard since it points you towards the main settings.
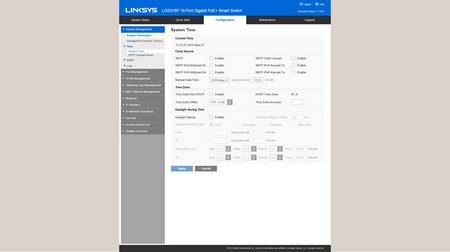
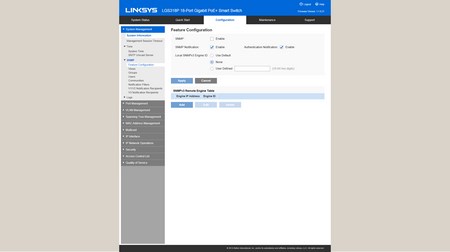
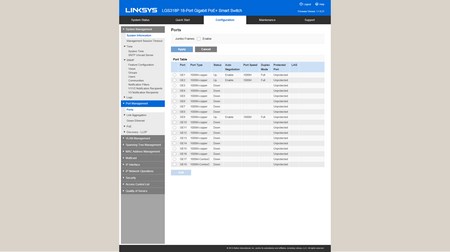
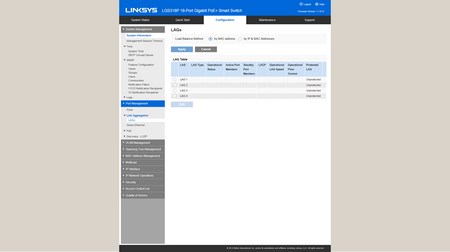
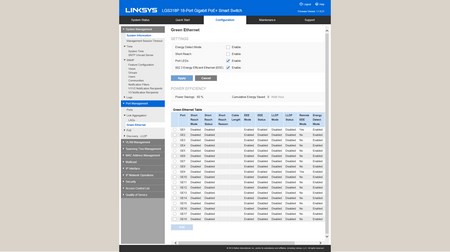
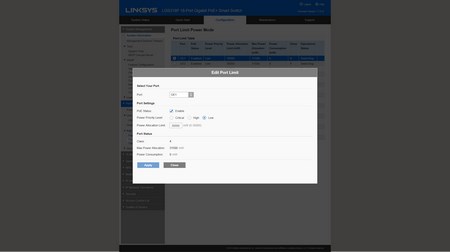
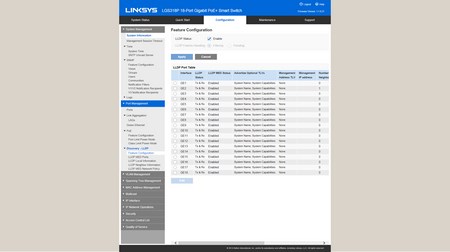
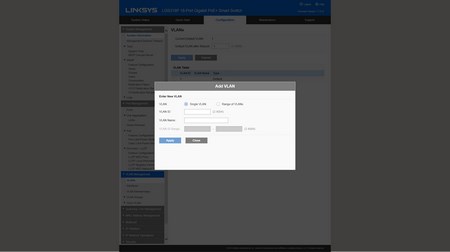
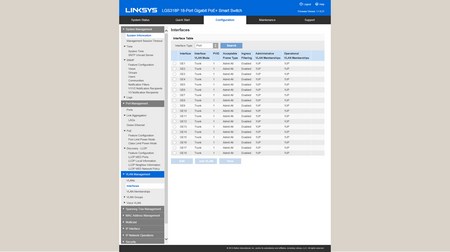
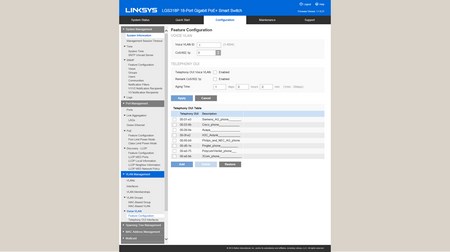
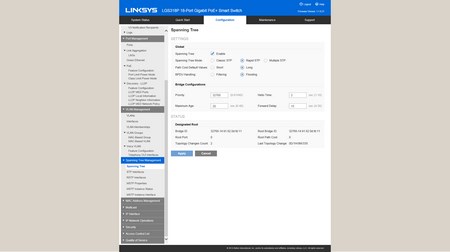
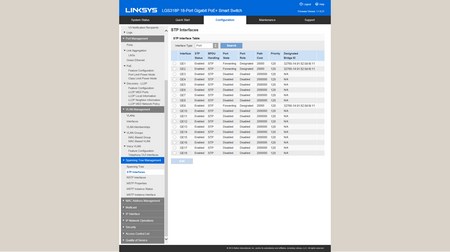
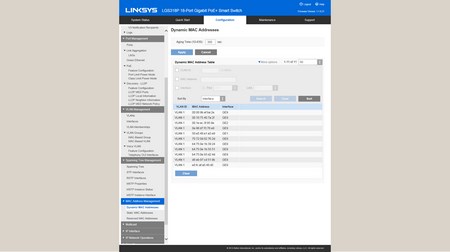
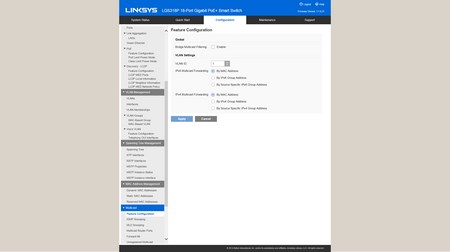
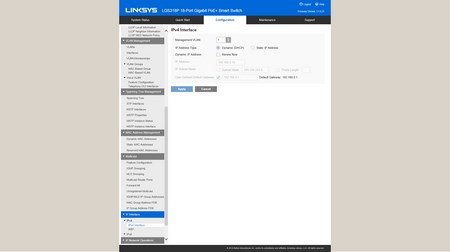
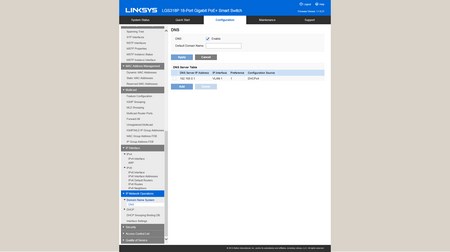
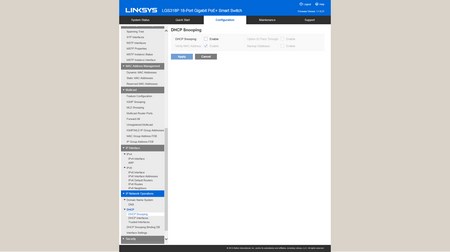
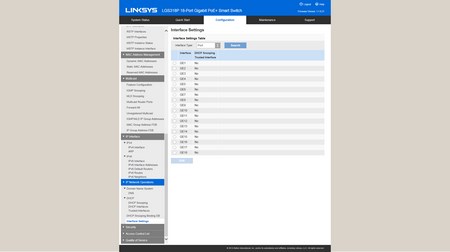
Accessing the configuration tab allows you to adjust the time, setup SNMP (simple network management protocol), manage all ports, enable link aggregation, enable/disable green and energy efficient Ethernet (for maximum performance we suggest disabling both features), prioritize power distribution, monitor power delivery, setup VLANs, adjust IPv4/6/MAC addresses, enable/disable DNS and finally you can use the Spanning Tree and DCHP snooping features.

 O-Sense

.jpg)




.png)

