O-Sense

.jpg)


WIREVIEW2 SOFTWARE V1.0.5
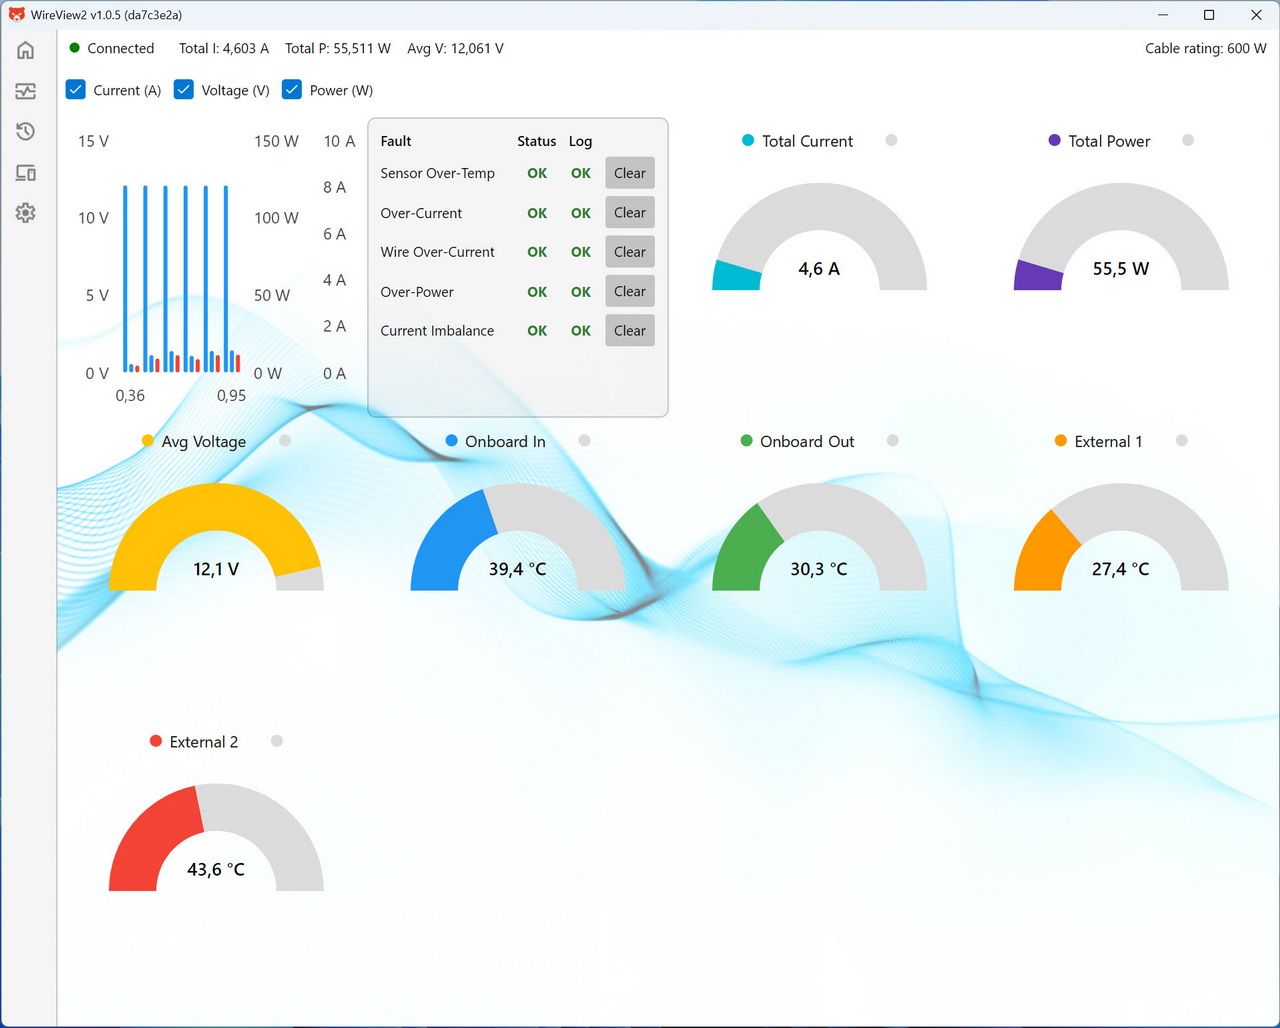
Initial tab is basically a monitoring dashboard showing total current, voltage, power draw, and multiple temperature sensors, along with a fault‑status panel that confirms whether any electrical or thermal limits have been triggered.
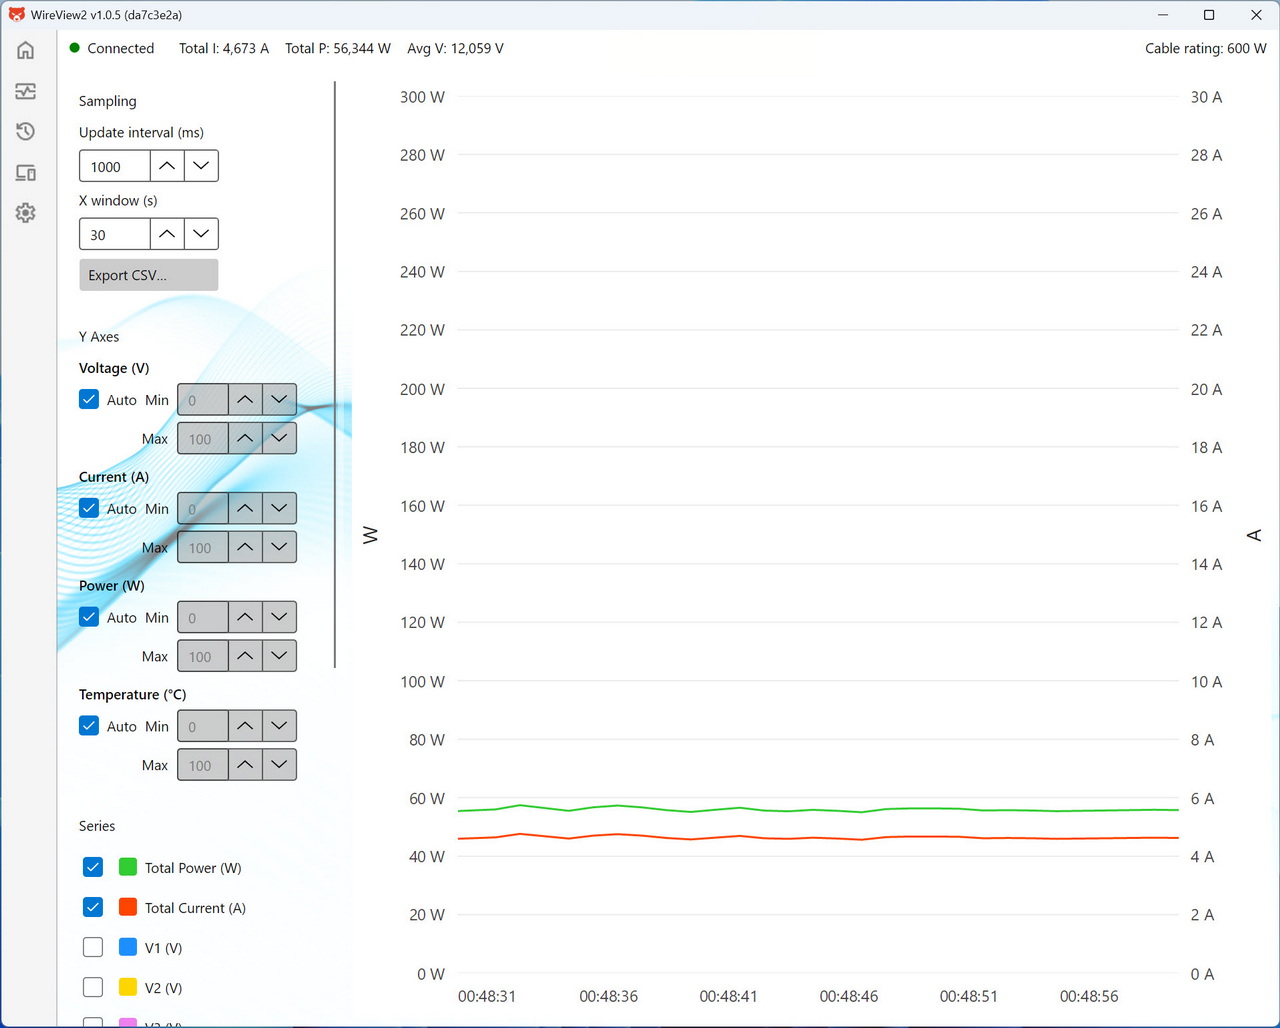
Second tab features a time‑based graph that plots total power, total current, and voltage lines, with adjustable sampling intervals and export options for logging and analysis.
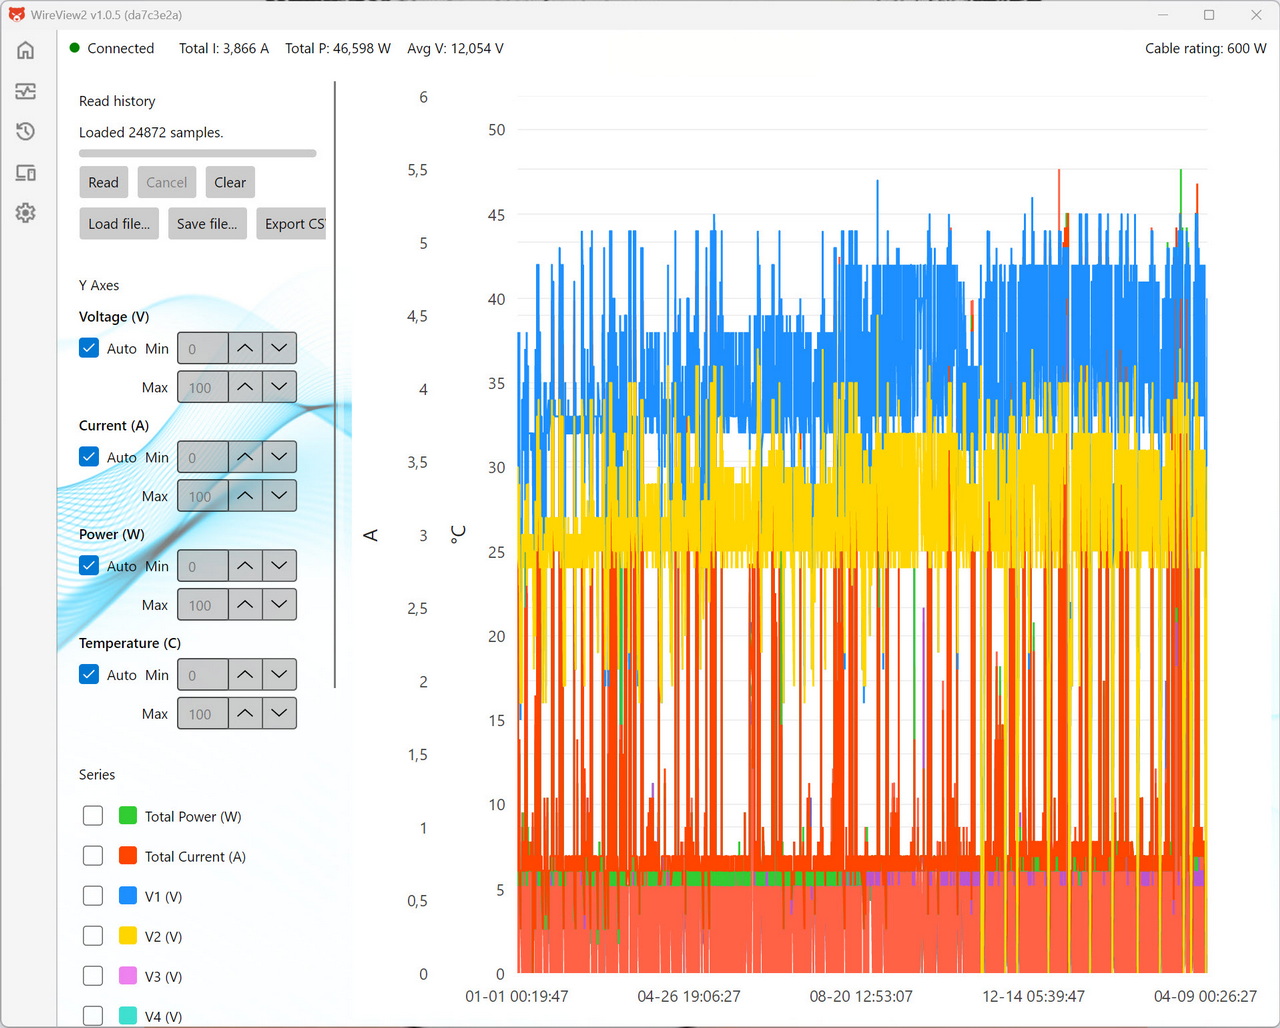
Next tab has a long‑duration graph displaying thousands of loaded samples, allowing users to inspect voltage, current, power, and temperature trends over extended periods for deeper diagnostics.
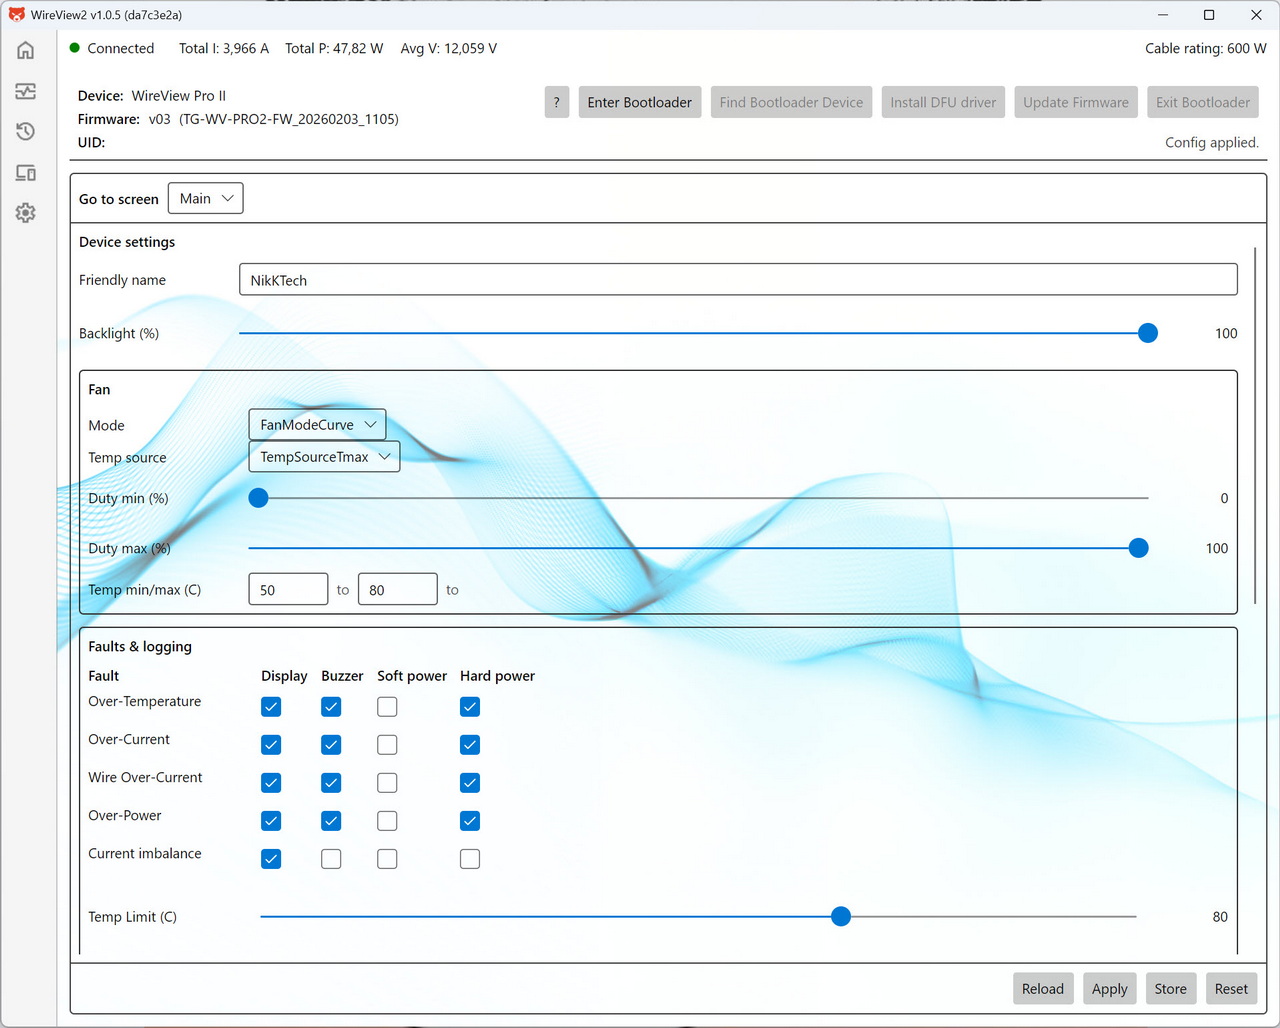
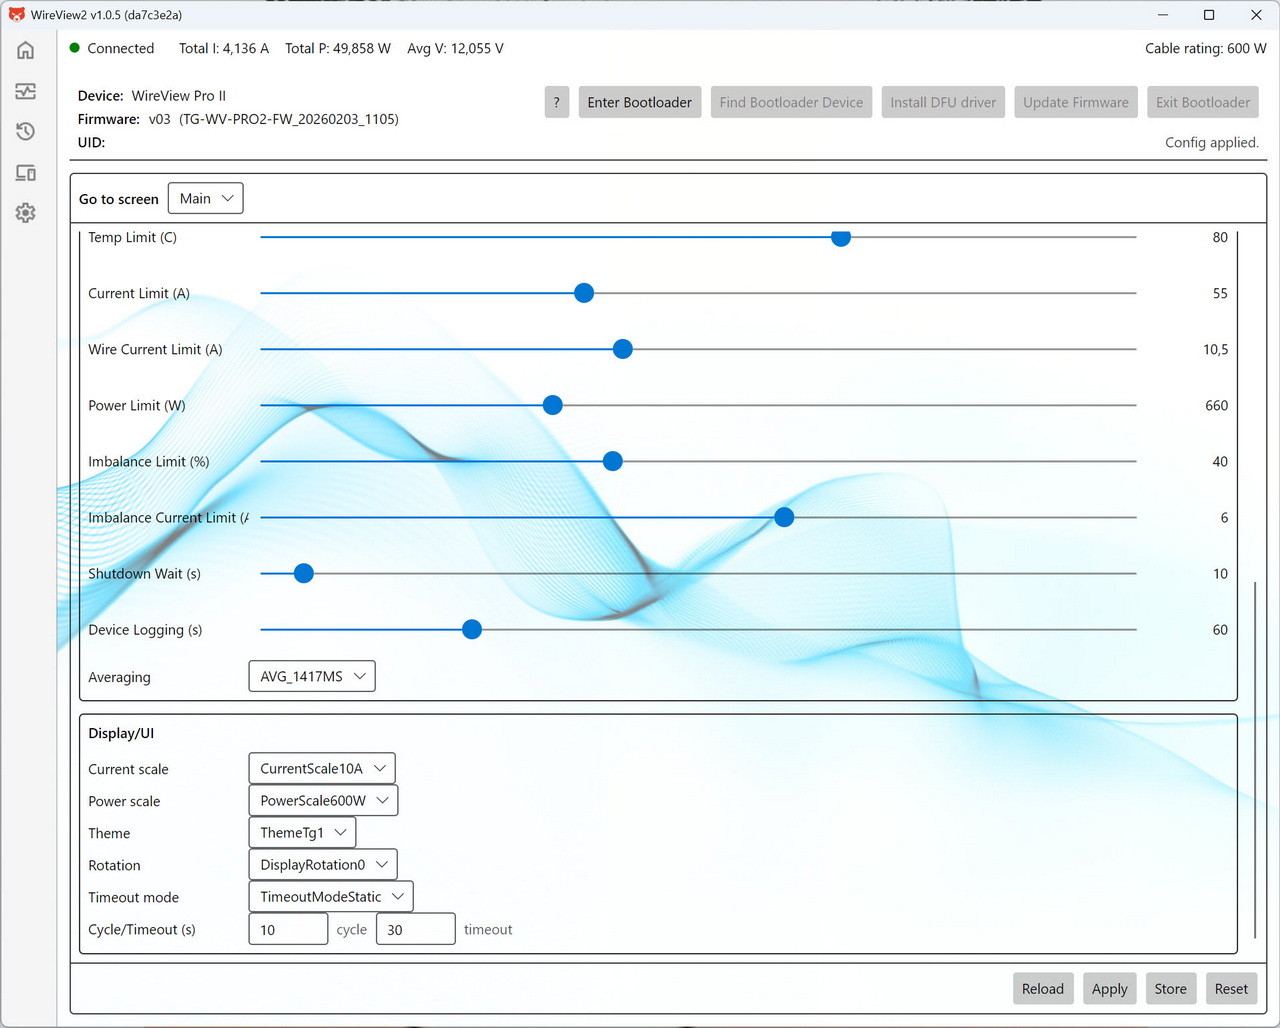
From the device tab you can rename the unit, adjust display brightness, configure the cooling‑fan curve, set how the device responds to various fault conditions, set temperature, current, wire‑current, power, and imbalance limits and adjust the display.
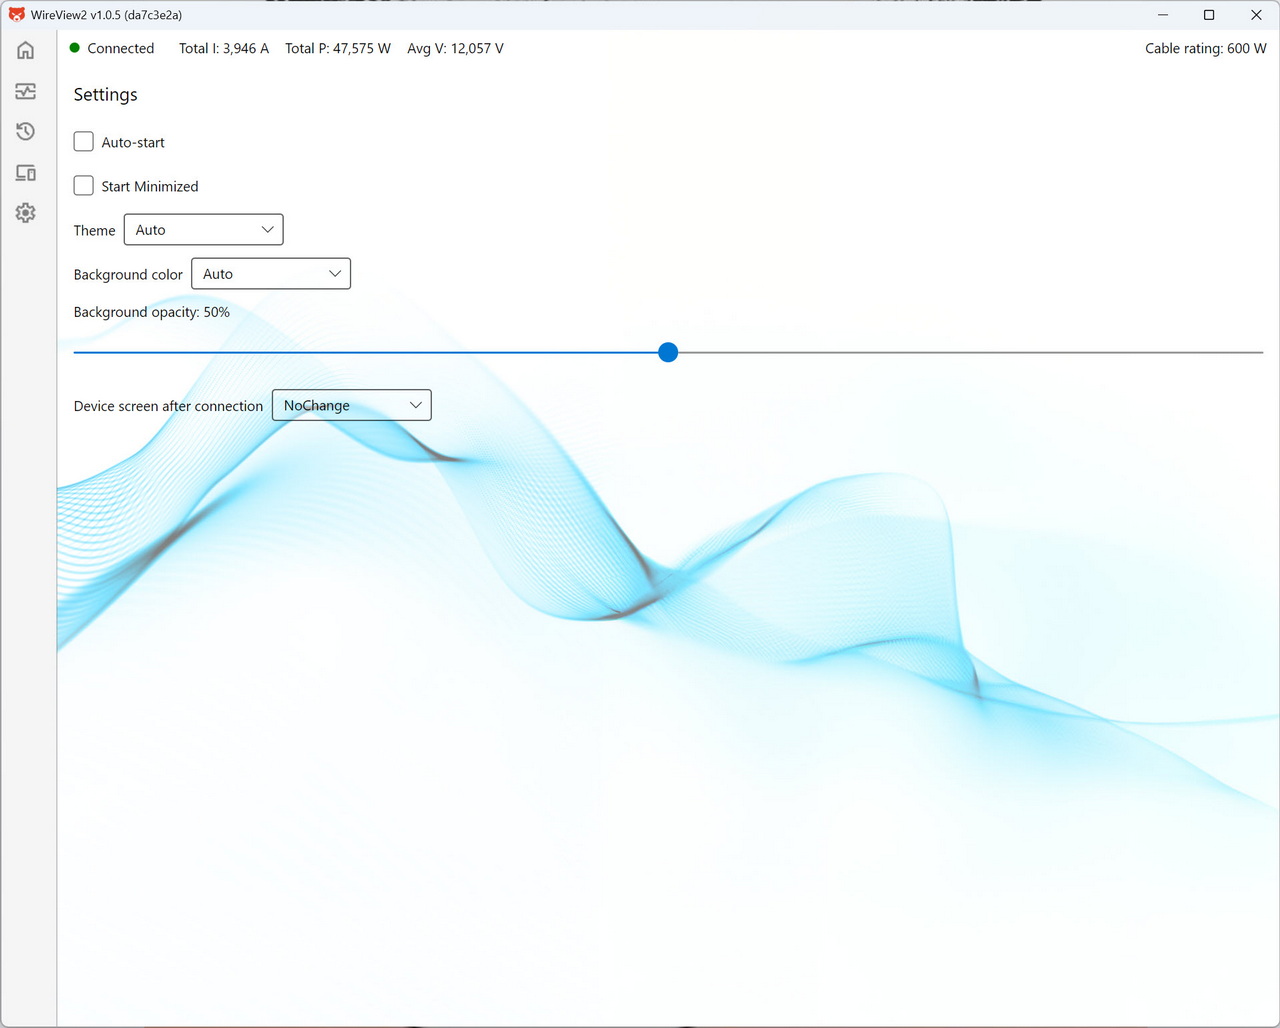
Inside the settings tab you can adjust UI preferences such as theme, background color, opacity, startup behavior, and what screen the device should show upon connection.


.png)